Recently it dawned on me how many people tweeting didn’t know about Twitter Analytics. Just like the other major social platforms, Twitter has its own analytics reporting tool, but you have to set it up for each account. Many people are used to having a business page run by a personal profile. As Twitter only has one profile per email, it doesn’t default to a set of analytics tools. So let’s dive in and learn how to set up and use Twitter Analytics.
Twitter Analytics
Connect
All you have to do for step 1 is sign in your Twitter account to the Twitter Analytics tool. It’s really that simple. You’ll find the tool here https://analytics.twitter.com/about If you want to open this link you can easily flip between the tabs to follow step-by-step. You’ll need your login credentials and the page will redirect you back to the Twitter Analytics dashboard with an option to “Get Started”.
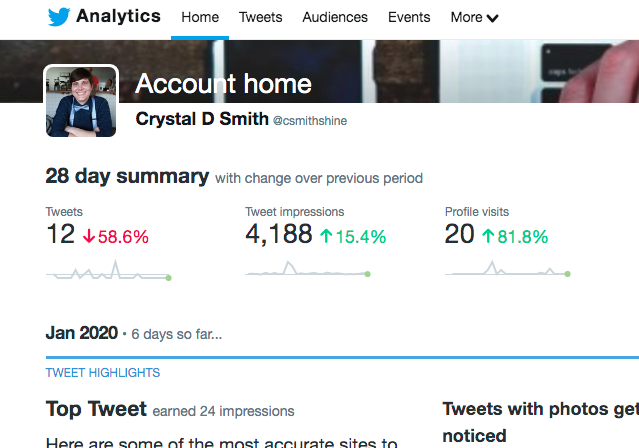
You’ll then be redirected to the main page of the dashboard. You’ll see a 28-day overview and as you scroll, it will display a breakdown by month.
Tweet Activity
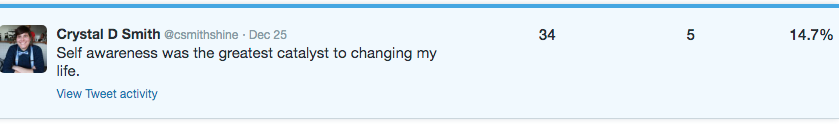
The first tab outside of the home dashboard is the Tweet tab. This will breakdown your Tweets. You’ll have options for date ranges, top tweets, link clicks, engagement scores, engagement rates, etc. You can also export data here. You are limited to the time frame you can access reporting for so be mindful and check often. The dashboard here makes it pretty easy to use. I like that the date range displays a quick shot of the total impressions over time.
What Do The Stats Mean?
As you’re looking at your Tweets in the dashboard here, you’ll notice it’s measured in 3 main categories as shown below.
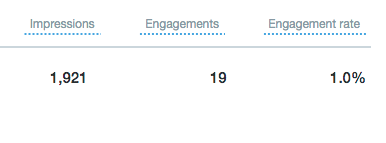
Impressions
This simply measures the number of times the Tweet was viewed by a user. It doesn’t necessarily mean 1,921 different people saw the Tweet, just that it was viewed 1,921 times by a number of users. The higher the number the better, especially since Tweets last less than seconds on a newsfeed, the shortest of any platform.
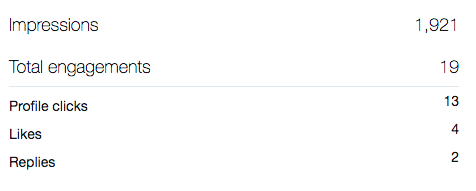
Engagement
This is the number of times any user, or a group of users, interact with your Tweet. This includes expanding the Tweet, replying, retweeting, following, like. Any action that can be taken to that particular Tweet is recorded here. Of course, higher is better with this number.
Engagement Rate
Engagements / Impressions = Engagement Rate. A large number is assumed by a higher engagement amount. This means that more people who viewed your Tweet also took action on it.
Navigating the Dashboard
By clicking anywhere on the numbers displays for each Tweet, you’ll get a separate window that breaks down the engagement.
You can also view this same data for your replies to other Tweets, or your own. This is under the tab ‘Tweets and Replies’. This will display the same data.
On the right-hand side, you’ll always see a bar graph highlighting the different engagement metrics over the time period specified in the search. This will cover link clicks, likes, retweets, replies, etc.
_________________________
I miss the Audience and Events sections of the Twitter Analytics but I still find that this new, stripped version is still effective. Analytics is a necessary part of planning, reviewing, and revising your social media strategies. If you didn’t know how to use this before, hopefully, this helps you better plan your course. If you have any Twitter tips or analytic advice you’d like to contribute, please share! Let’s connect on Twitter and let me know your thoughts and experiences.

Thanks for reading, May The Force Be With You